From blazing a trail in social return on investment to studying how social enterprises position the toughest to employ for economic mobility, REDF has been focusing on “employment social enterprise” since well before it was coined into law.
Now, in service to our theory of change, we are carefully studying the indirect impact REDF has on ESEs in the larger field of economic mobility — while also looking inward to study the direct impact our investment has on ESEs and their leaders.
Throughout our learning journey, we see ourselves more as peer learners than as professors. We work alongside our ESE partners to make sense of the data we see — both in communities of practice (through Listen4Good) and with our portfolio at key inflection points. And we strive to do so within equitable evaluation frameworks that live up to our values of mutuality and trust.
Below are key findings over the years from studies we have commissioned, led, or supported.
CA Employment Social Enterprise Long-term Earnings Analysis
20+
point jump in income percentile post-ESE
CA Employment Social Enterprise Long-term Earnings Analysis
Careful evaluation has revealed:
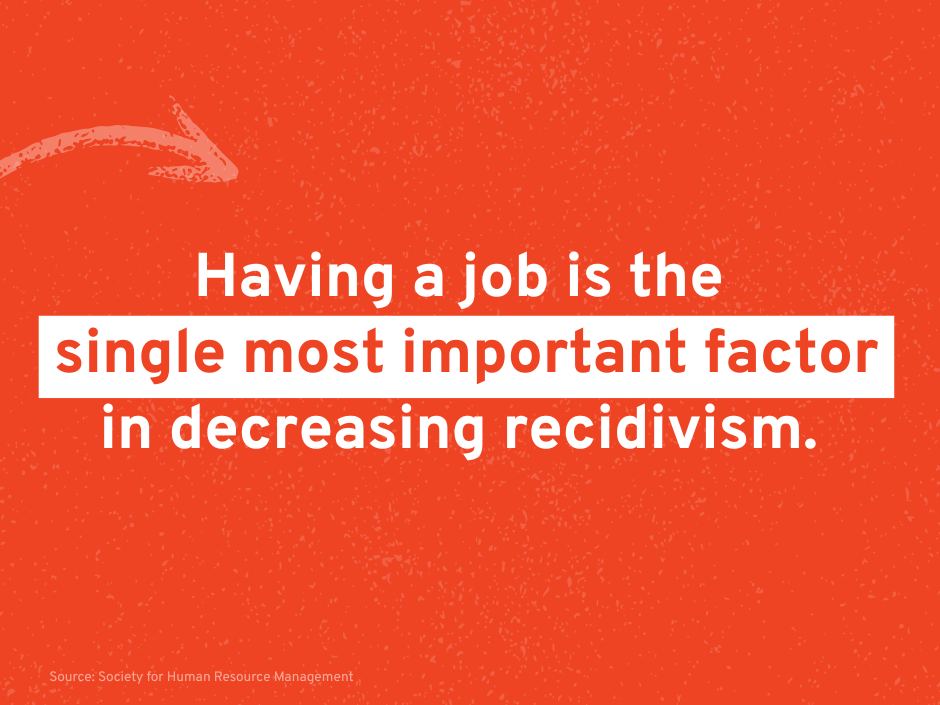
ESEs help participants obtain and maintain employment
California’s Employment Development Department (EDD) employment data on past ESE workers shows average employment rates ranging from 20-40% prior to joining an ESE, and jumping to 60-70% immediately afterwards.2 While rates dip then level off at two years, employment rates remain higher up to seven years post-ESE engagement than at any point prior to joining an ESE.1 This was also supported by the LA:RISE study, which saw a short-term improvement in employment rates for ESE participants5, and the Mathematica Jobs Study in which the percent of individuals currently employed rose by 33 percentage points (18% at intake to 51% at follow up).4
ESEs help participants increase their earning potential
Analyses by REDF and Mathematica Policy Research on employment and earnings data confirmed that earnings for working individuals continue to climb ~7 years after they leave an ESE, and remain above pre-ESE engagement levels. 1 Average earnings for those employed rose steadily after exiting the ESE.2
Participants typically moved from the 25th income percentile bracket prior to working at an ESE to the 45th–50th percentile range three years later.1
More rigorous studies in which ESE program participants are compared to a control group show statistically significant differences for the former: The ESE group earned nearly a third more in the prior month than the comparison group a year after intake.3 Total monthly income rose 91%, while receipt of government funds fell 46 percentage points (71-25%).4
ESE participation boosts housing stability
The Mathematica Jobs study suggests that housing stability seemed to improve with ESE employment, with nearly half, or 44% of ESE workers reporting being in stable housing a year after engagement (compared to 16% at intake).4
Similarly, the RTI Study showed housing stability moving in a positive direction along with ESE engagement.3
The unique ESE model impacts employees’ lives
Those who were with an ESE at least 12 months had much higher employment rates than others, and four years later also had higher earnings; individuals working 30+ hours had the highest employment and earnings outcomes.1,2
In addition, through an innovative study analyzing participant feedback, REDF has found that ESEs’ unique model – the support ESEs provide, relationships that are built, and employees’ perceptions of ESE work – influence outcomes: Over the longer term, feeling that ESE staff treated them with respect was associated with an ESE worker being employed, while the ESE worker’s general satisfaction with the ESE was associated with working at least 30 hours/week, and interacting frequently with the ESE predicted higher wages.3
ESEs generate social return on investment
REDF helped advance the concept of Social Return On Investment which quantifies the socio-economic benefits of investing in ESEs by calculating cost savings for different entities.
The RTI study showed that for each dollar spent by an ESE, they create $1.13 of benefit for society (13% ROI on each dollar). Note that for individual ESEs, the ROI differed significantly, demonstrating the effect of different models, allocation of costs, etc.3
The Mathematica Jobs Study CBA showed that in general, for each dollar spent by an ESE, they create $2.23 of benefit for society (123% ROI), and $1.13 for taxpayers.4
The difference in ROI between the former two studies exemplifies the implications of finding different impacts which are then used in a cost benefit analysis, and the variation in assumptions and allocations for costs and benefits.
ESEs are a leading strategy to advance US gun violence prevention